How To Create An Excel Spreadsheet

Discover step-by-step guidance on how to create an Excel spreadsheet that can be shared and edited with ease, empowering you to efficiently organize and analyze data.
Data management and analysis have become essential skills for individuals and businesses alike. One of the most powerful tools for handling data efficiently is Microsoft Excel.
Whether you’re a seasoned professional or a beginner, this guide will walk you through the process of creating an Excel spreadsheet and help you unleash its full potential.
So, let’s dive right in and learn how to create an Excel spreadsheet like a pro!

What is Excel?
Excel is a powerful spreadsheet software developed by Microsoft, widely used for data analysis, calculations, and creating visual representations of data. It offers a grid of cells organized in rows and columns, where users can enter and manipulate data efficiently.
The Benefits of Using Excel
Excel offers numerous advantages that make it a go-to tool for data manipulation and analysis:
Data Organization: Excel’s grid-like structure enables you to organize data neatly in rows and columns, making it easy to interpret and manage.
Data Analysis: With powerful built-in functions and formulas, Excel enables you to perform complex calculations, making data analysis efficient and accurate.
Visual Representation: Excel allows you to create visually appealing charts and graphs, helping you present data in a more understandable and compelling way.
Data Validation: You can apply data validation rules to ensure data integrity and reduce errors when entering information.
Automation: Excel’s macros and VBA (Visual Basic for Applications) allow you to automate repetitive tasks, saving time and effort.

Understanding the Excel Interface
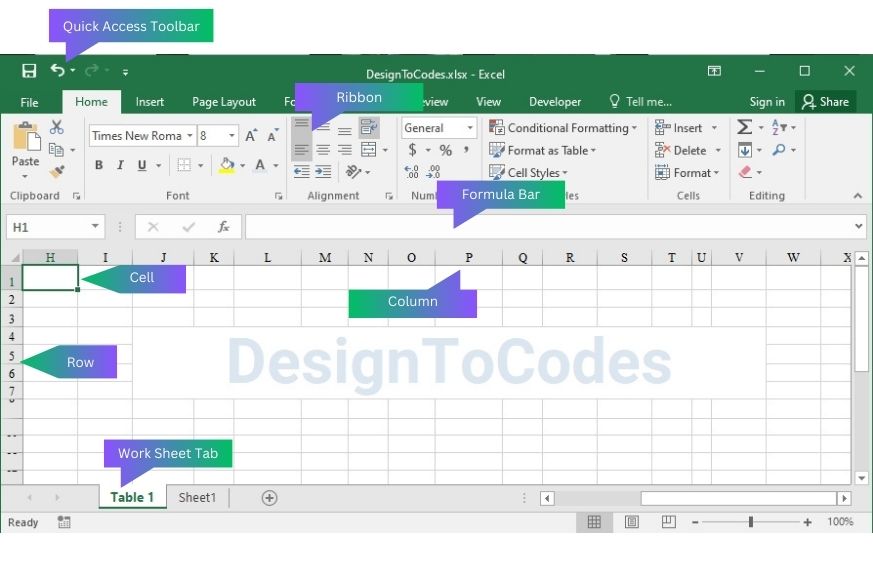
Upon opening Excel, you’ll be greeted with a blank workbook. The interface consists of various elements:
Ribbon: The Ribbon is located at the top and contains tabs, each with related commands. It simplifies the process of finding specific functions.
Worksheets: By default, a new workbook contains three worksheets (Sheet1, Sheet2, Sheet3) located at the bottom. You can add or delete sheets as needed.
Columns and Rows: The vertical columns are labeled with letters (A, B, C…), and the horizontal rows with numbers (1, 2, 3…).
Cells: The intersection of a row and column forms a cell. Each cell holds data, text, or formulas.
Formula Bar: The Formula Bar displays the contents of the active cell and allows you to enter or edit data and formulas.
Quick Access Toolbar: This customizable toolbar provides quick access to frequently used commands.
How to Create an Excel Spreadsheet?
Let’s learn how to create an Excel spreadsheet.
Creating a New Workbook
To create a new workbook, click on the “File” tab in the top-left corner, then select “New.” Choose “Blank Workbook” to start with a clean slate.
Entering Data
In Excel, you can enter data into cells by simply clicking on a cell and typing the information. You can move to adjacent cells using the arrow keys or by pressing the “Tab” key.
Formatting Cells
Formatting cells enhances the appearance and readability of your spreadsheet. You can apply various formatting options such as:
- Font Style and Size: Make text bold, italic, or underlined, and adjust the font size to emphasize important information.
- Number Formats: Customize the display of numbers as currency, percentages, dates, or decimals.
- Cell Alignment: Align text left, right, or center within a cell to improve readability.
- Cell Borders: Add borders to cells or ranges to distinguish data visually.
Inserting and Managing Rows and Columns
To insert a new row or column, right-click on the row number or column letter, then select “Insert.” Conversely, to delete a row or column, right-click and choose “Delete.”

Using Formulas and Functions
Explore the step-by-step guide on how to create an Excel spreadsheet, master the fundamentals of organizing data, and optimize your workflow by using formulas and functions.
Excel Formulas
Formulas are at the heart of Excel’s power. They allow you to perform calculations using the data in your spreadsheet. Formulas begin with the “=” sign, followed by the mathematical expression or function.
Common Excel Functions
Excel offers a wide range of built-in functions that cater to various data manipulation needs. Some popular functions include:
- SUM: Adds a range of cells.
- AVERAGE: Calculates the average of a range of cells.
- MAX and MIN: Find the highest and lowest values in a range.
- COUNT: Counts the number of cells with numerical values within a range.
Using Absolute and Relative References
When creating formulas, you can use absolute references (e.g., $A$1) or relative references (e.g., A1). Absolute references stay fixed, while relative references change when copied to other cells.

Visualizing Data with Charts
You need to visualize data with charts to unlock the potential of how to create an Excel spreadsheet. Follow the step bellow:
Creating a Chart
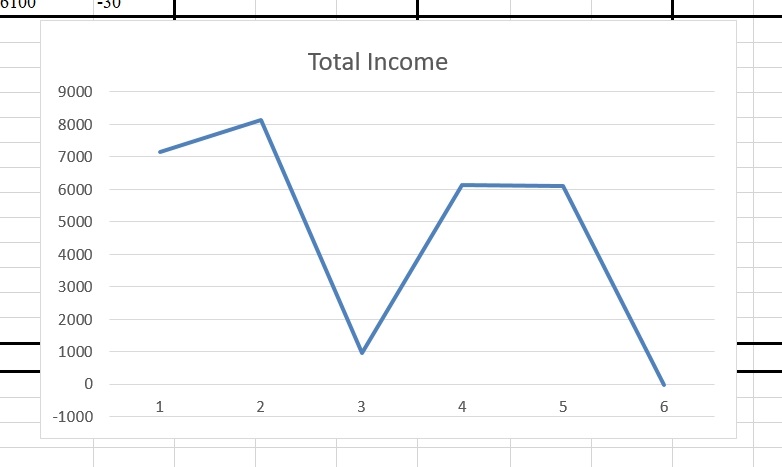
Excel offers various chart types, including column charts, line charts, pie charts, and more. To create a chart, select the data you want to visualize, click on the “Insert” tab, and choose the desired chart type.
Customizing Charts
You can customize charts to match your preferences and the data you want to present. Excel allows you to adjust chart titles, axis labels, colors, and styles.
Adding Sparklines
Sparklines are mini-charts that fit into a single cell, giving a quick visual summary of data trends. To add a sparkline, select the cell where you want it and choose the appropriate type from the “Sparklines” option under the “Insert” tab.
Advanced Excel Features
Learn advanced Excel features for how to create an Excel spreadsheet with ease
Data Validation
Data validation helps prevent errors by restricting the type of data that can be entered into specific cells. You can set validation rules to allow only certain values, dates, or numeric ranges.
PivotTables
PivotTables are powerful tools for data analysis and summarization. They allow you to transform large datasets into concise, meaningful reports with just a few clicks.
Conditional Formatting
Conditional formatting enables you to apply different formats to cells based on specified conditions. This feature highlights important data and trends.
Macros and VBA
Macros are recorded sets of actions that can be played back to automate tasks. VBA allows you to create more complex and custom automation procedures.
Tips for Excel Efficiency: How to Create an Excel Spreadsheet
- Keyboard Shortcuts: Learn common Excel keyboard shortcuts to speed up your work and increase productivity.
- Use Named Ranges: Assign names to ranges of cells for easier reference in formulas.
- Freeze Panes: Keep headers and labels visible by freezing rows or columns as you scroll.
- Protect Sheets: Protect sensitive data by applying sheet passwords and restrictions.
- Regular Backups: Always save backups of your important Excel files to prevent data loss.
Conclusion: How to Create an Excel Spreadsheet
Excel is a powerful tool that empowers individuals and businesses to manage and analyze data effectively. In this guide, we explored the basics of creating and formatting spreadsheets, using formulas and functions, mirroring data with charts, and utilizing advanced features.
Remember, mastering Excel takes time and practice. As you delve deeper into its capabilities, you’ll find yourself becoming more proficient and confident in handling complex data tasks.
So, start using Excel to its full potential, and you’ll soon leave your competition behind in the world of data management and analysis!
- Categories: How To
Share This Post
Subscribe To Our Newsletter
Get More Update and Stay Connected with Us


